Summary of Mr. Carlos Emmanuel Reina Jimenez account balance in 2024 from his Banco Estado bank, Chile.
Client - Data Origins
Carlos Emmanuel Reina Jimenez (brother). We obtained the data from him.
Tools
Excel, Power BI
In this project, we obtained the data from his 2024 banking statements, which were provided in Excel format. As the data was unorganized, we had to clean and structure it. I created the appropriate table, organized the columns and rows by date, and configured the currency settings correctly to avoid errors.
I imported the data into my Power BI project and made some final adjustments using Power Query. Then, I began designing the dashboard and answering the questions based on my analysis of the visuals.
Goal
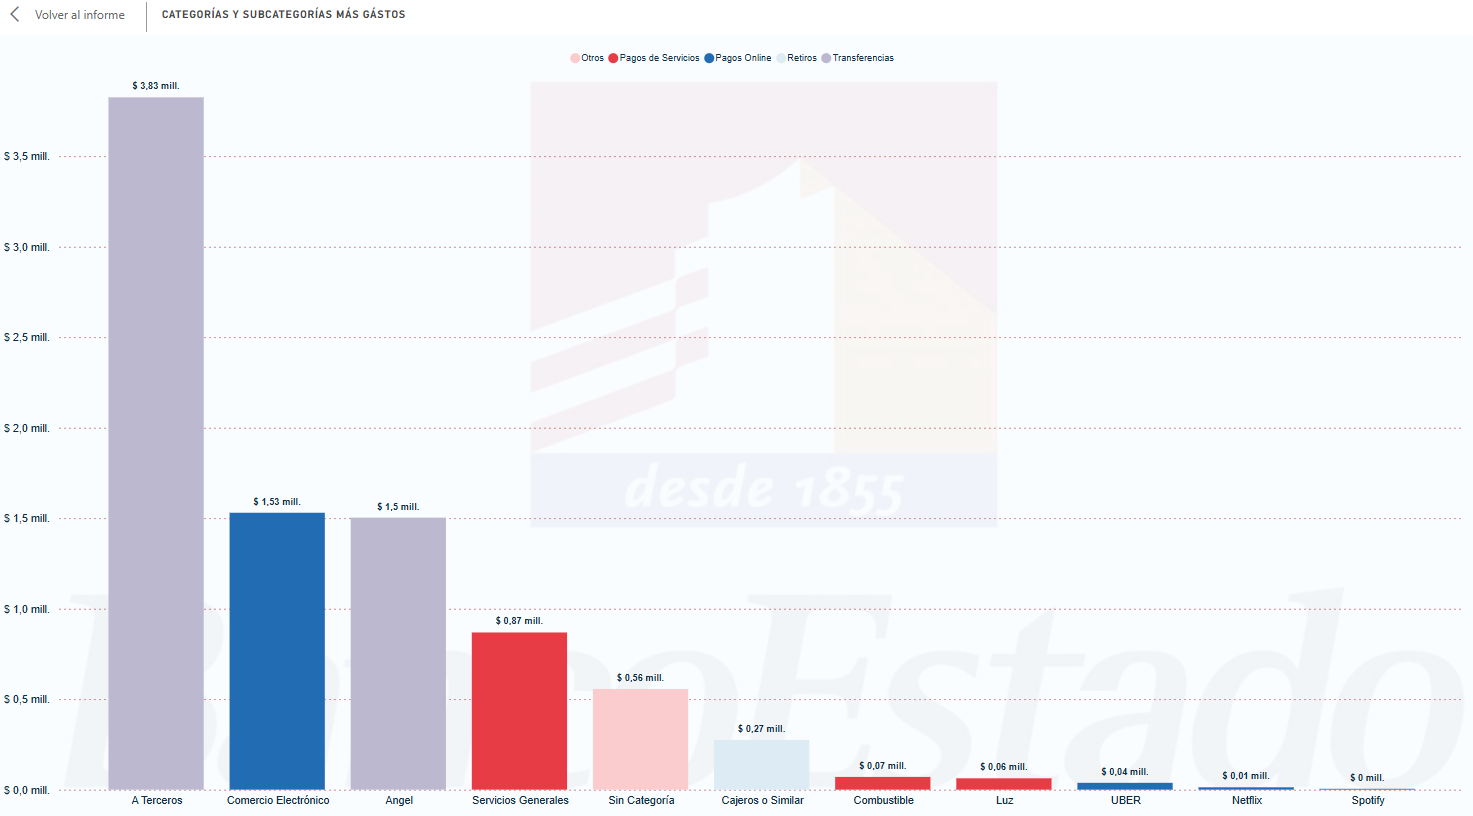
We wanted to find out the nature of the bank account movements, including the types of transactions and the products where we observed the most expenses. Our goal was to categorize these expenses and determine the months with the highest expenditure. Additionally, we wanted to identify the categories and months in which the client received the most income.
This analysis aims to provide a better understanding and awareness of expenses, enabling the development of strategies to minimize unnecessary spending in 2025.
Results
We discovered multiple factors that led Mr. Carlos to incur significant expenses. However, the most problematic issue was his failure to categorize his transactions, preventing him from knowing exactly how he was spending his money.
Despite this, we were able to identify some trends in his spending, such as E-Commerce, expenses related to “Angel” (his wife), and general services.
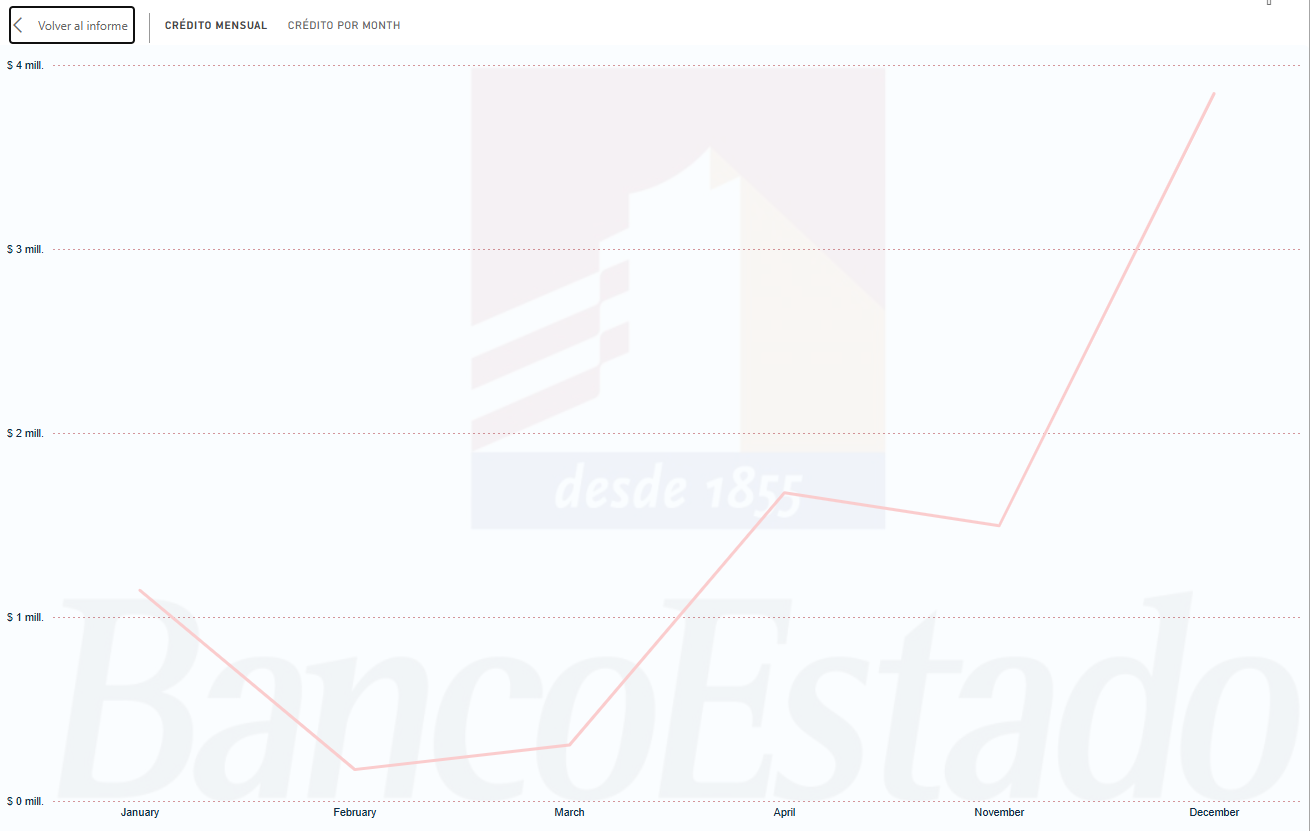
We were also able to identify December as the month in which he spent the most.
Project Duration
It was a small project so it took around a week to develop.
Conclusions
This is a finantial project that shows my knowledge in the area. The project is in Spanish, since the data source was in this language as well as the final “client”. We implemented tools like Excel and Power Bi and Power Query, to clean, organize and visualize the data. The results we almost the expected and the client was impressed. You can see the whole project here: