This is a campaign analysis conducted between October and December 2024 by the Customer Service department of a prestigious company.
Client - Data Origins
We obtained the raw data from an anonymous customer service campaign. Of course, it isn’t the real data; we modified it to avoid violating the company’s privacy policy.
Tools
Excel, SQL, Power BI
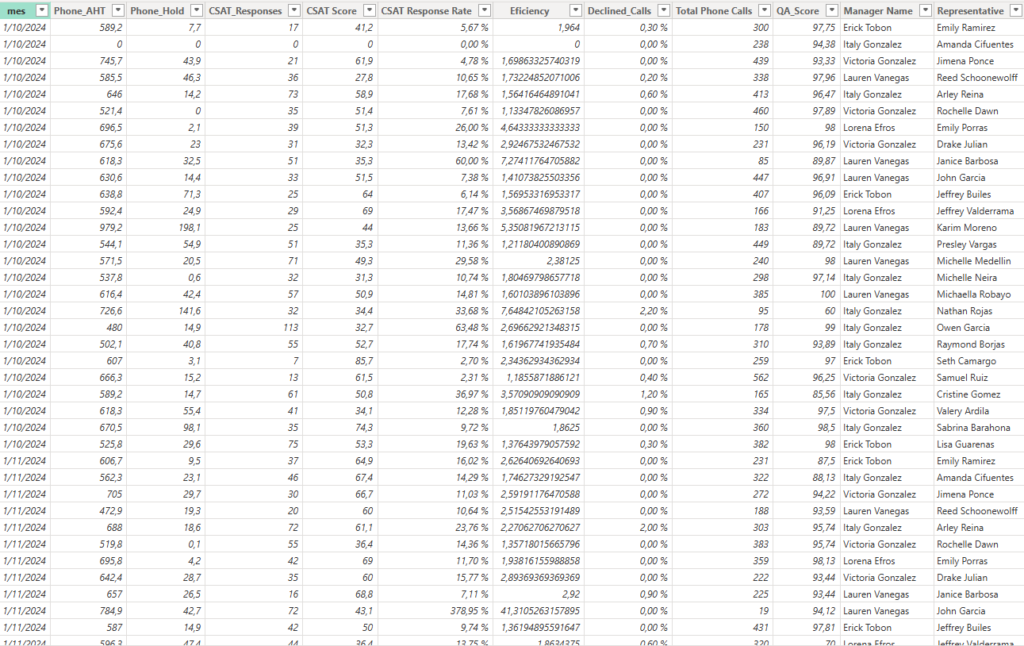
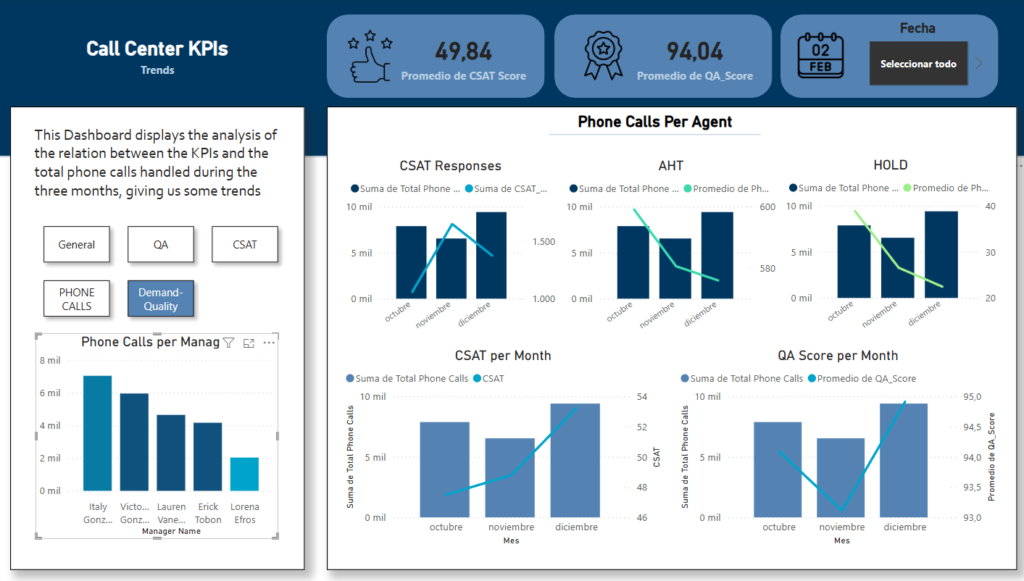
In this project, I obtained the data from a customer service campaing. The data was modified to avoid violations on the privacy of the company. I got the data in multiple Excel files and I turned them into some .csv files. Then I exported those files in SQL Server Management Studio. I created some queries to have more data to analize.
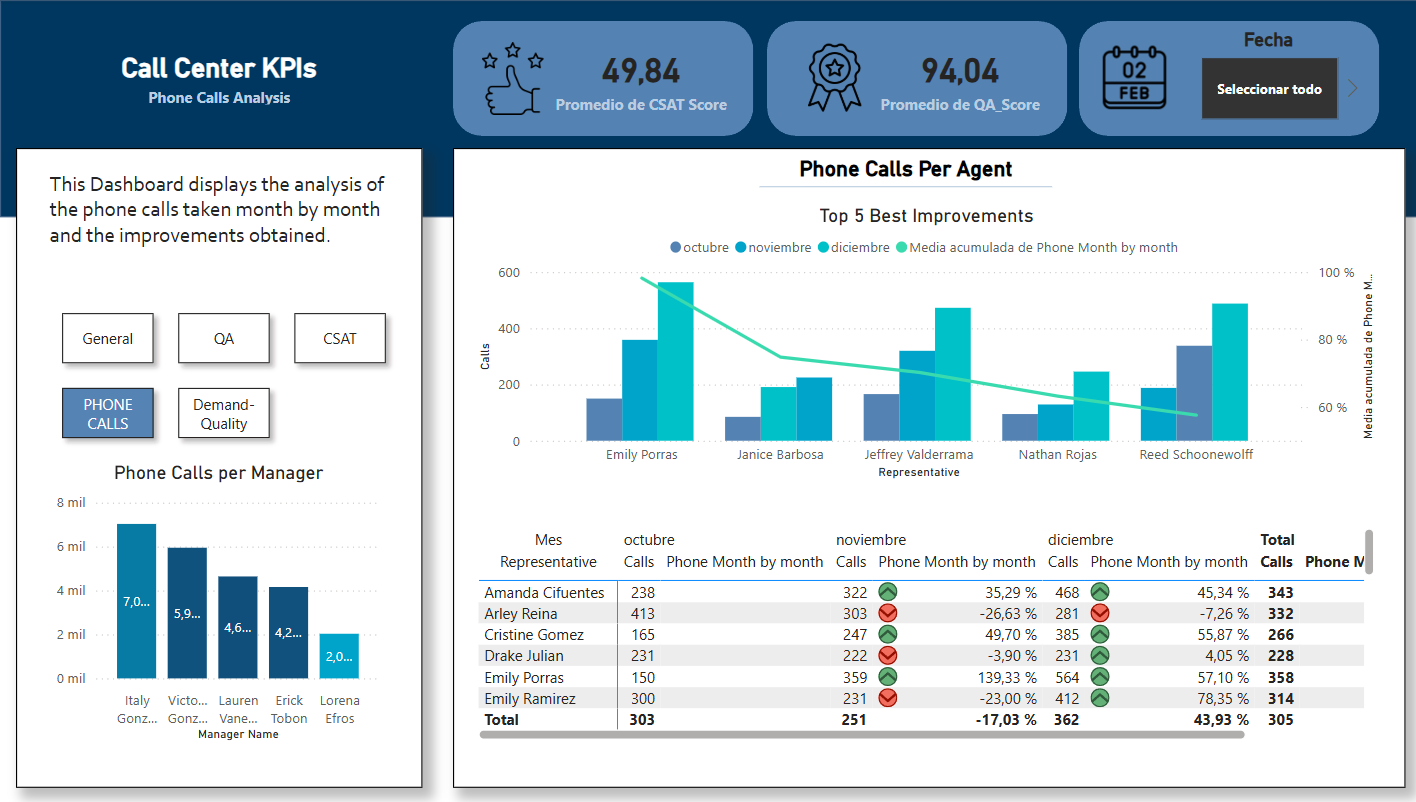
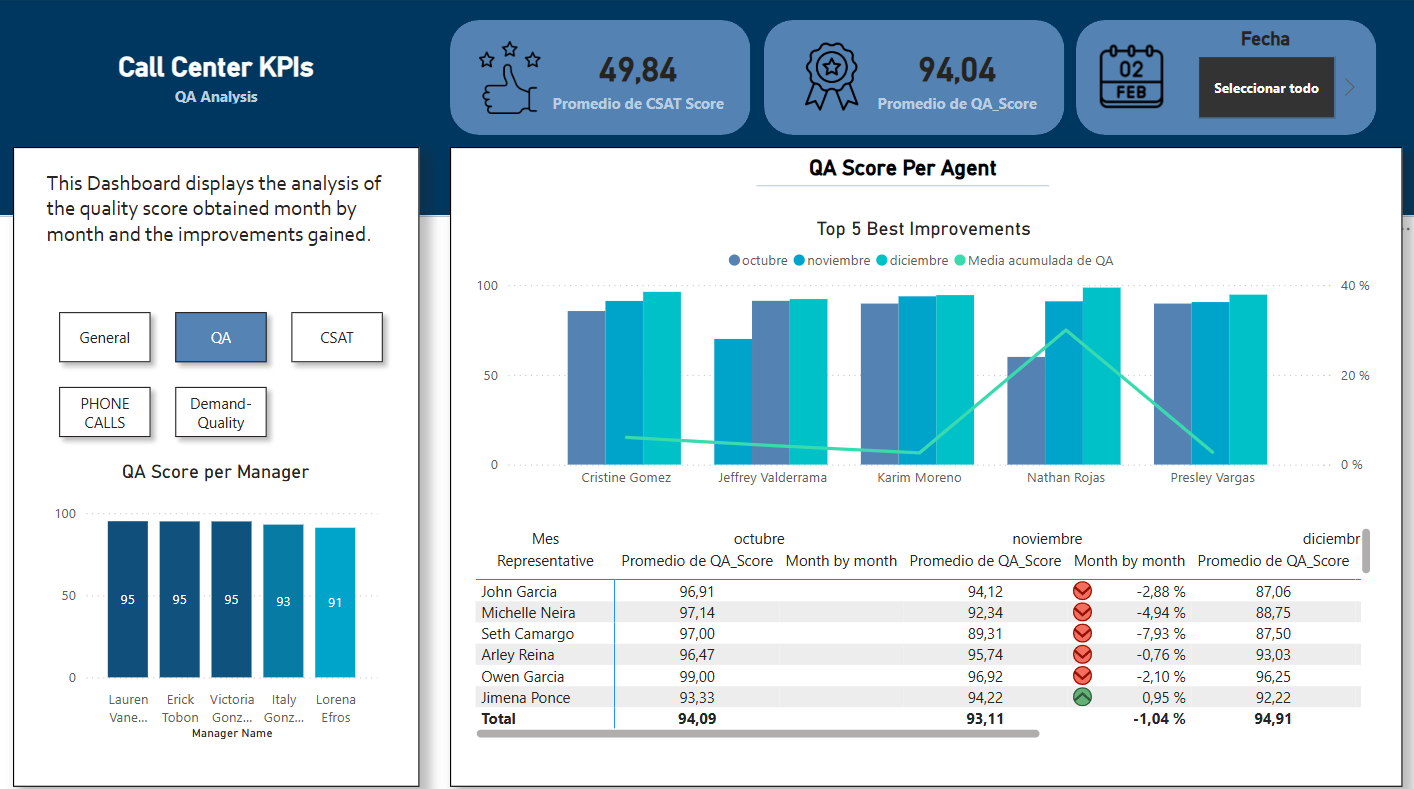
I imported the SQL file to my Power BI project to start to create the visualizations.
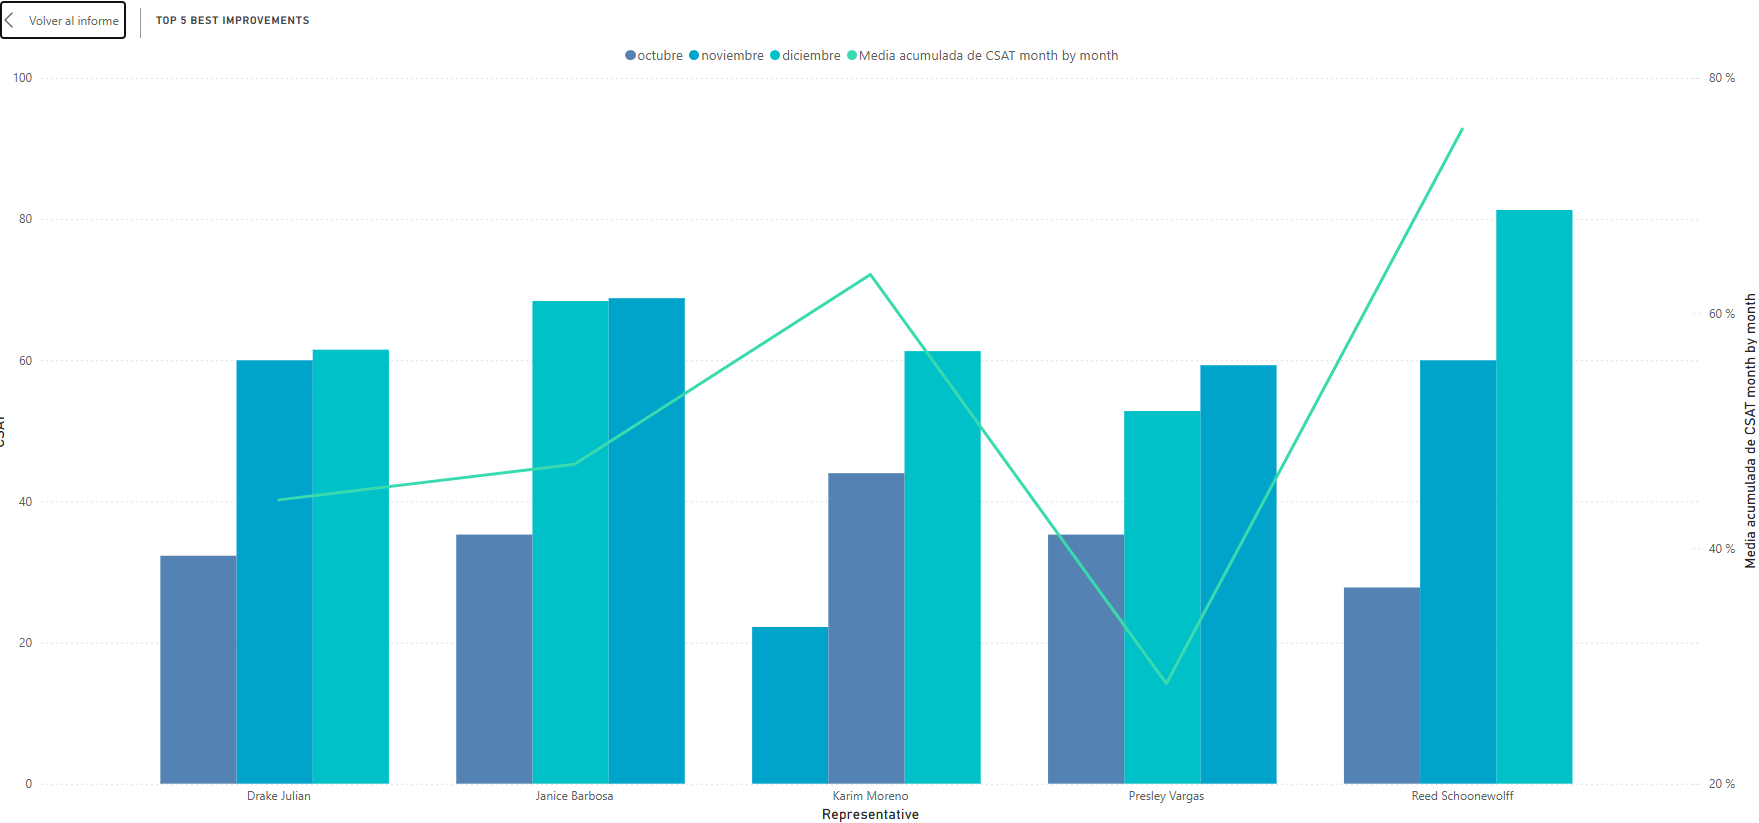
I connected myself to the queries I created in SQL Server Management Studio. Then I geve structure and organization with Power Query and started to create all the charts needed to create the report.
Goal
We wanted to find out the nature of the bank account movements, including the types of transactions and the products where we observed the most expenses. Our goal was to categorize these expenses and determine the months with the highest expenditure. Additionally, we wanted to identify the categories and months in which the client received the most income.
This analysis aims to provide a better understanding and awareness of expenses, enabling the development of strategies to minimize unnecessary spending in 2025.
Results
We discovered multiple factors that led Mr. Carlos to incur significant expenses. However, the most problematic issue was his failure to categorize his transactions, preventing him from knowing exactly how he was spending his money.
Despite this, we were able to identify some trends in his spending, such as E-Commerce, expenses related to “Angel” (his wife), and general services.
We were also able to identify December as the month in which he spent the most.
Project Duration
It was a small project so it took around a week to develop.
Conclusions
In this project, I demonstrated my abilities in data cleaning and structuring, using .csv and Excel files. The data structuring was the most challenging part of this project. I also utilized my skills in SQL to create queries necessary to complete my analysis with the help of SQL Server Management Studio. Lastly, I used Power BI to finalize the data structuring with Power Query, and I selected the most effective charts to present the story of my data.